earning programming is easy but excelling in a particular field is hard. With an exponential rise in the demand of coding-related jobs, this field has become more competitive than ever. So, for passing with flying colors, one needs to make various coding career related decisions carefully.
Front-end Roadmap
Back-end Roadmap
DevOps Roadmap
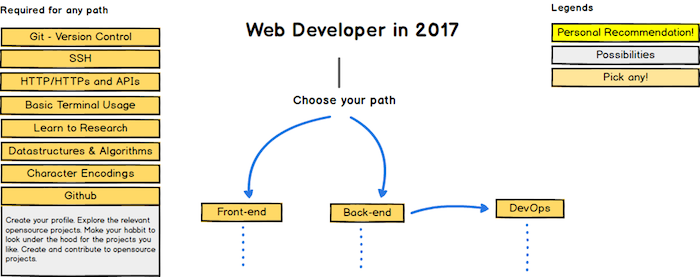
Recently, I came across a set of charts that I found very interesting. So, I thought why not share it with Fossbytes readers. These charts demonstrate different paths you can take and the technologies that are needed to become a backend, a frontend, or a devops.
Shared by a GitHub user
Before going ahead and telling you about these paths, take a look at the introduction part that tells you some technologies for every path and how to read this chart:
Front-end Roadmap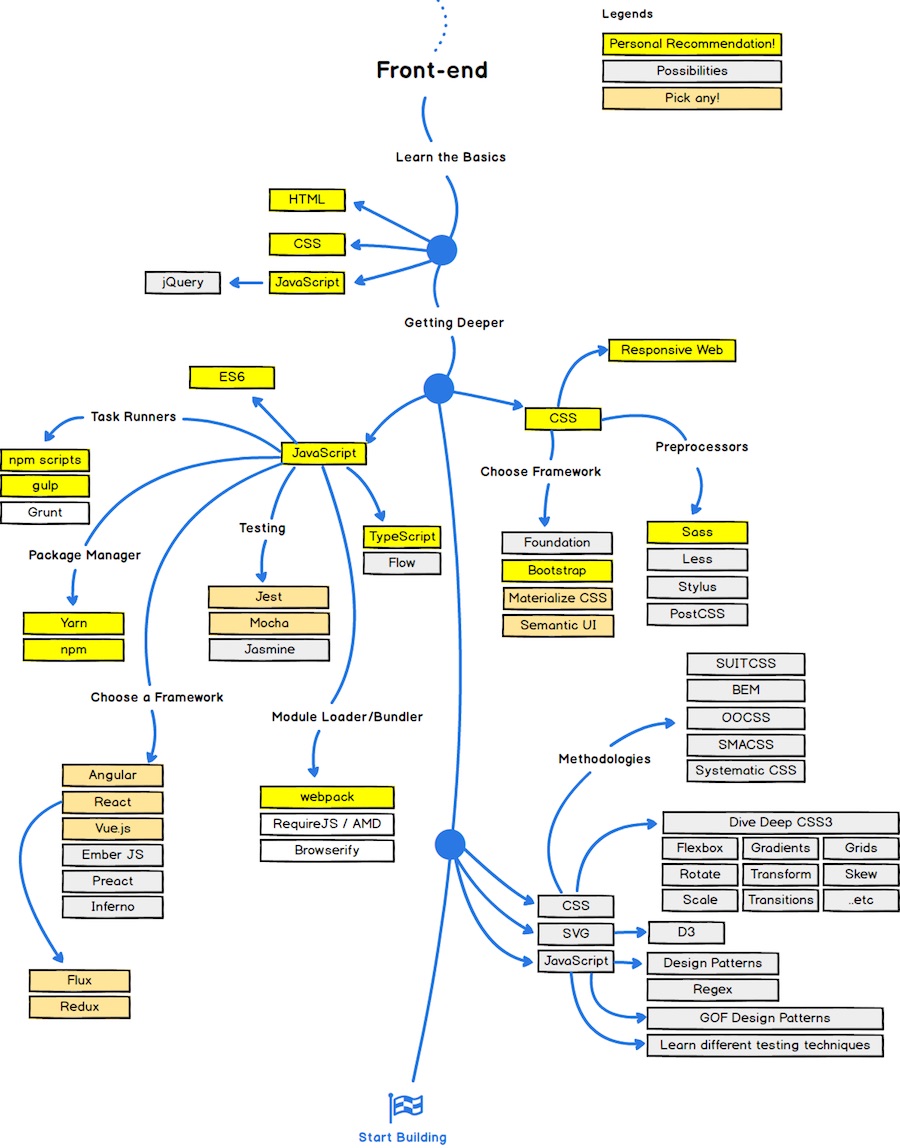
Back-end Roadmap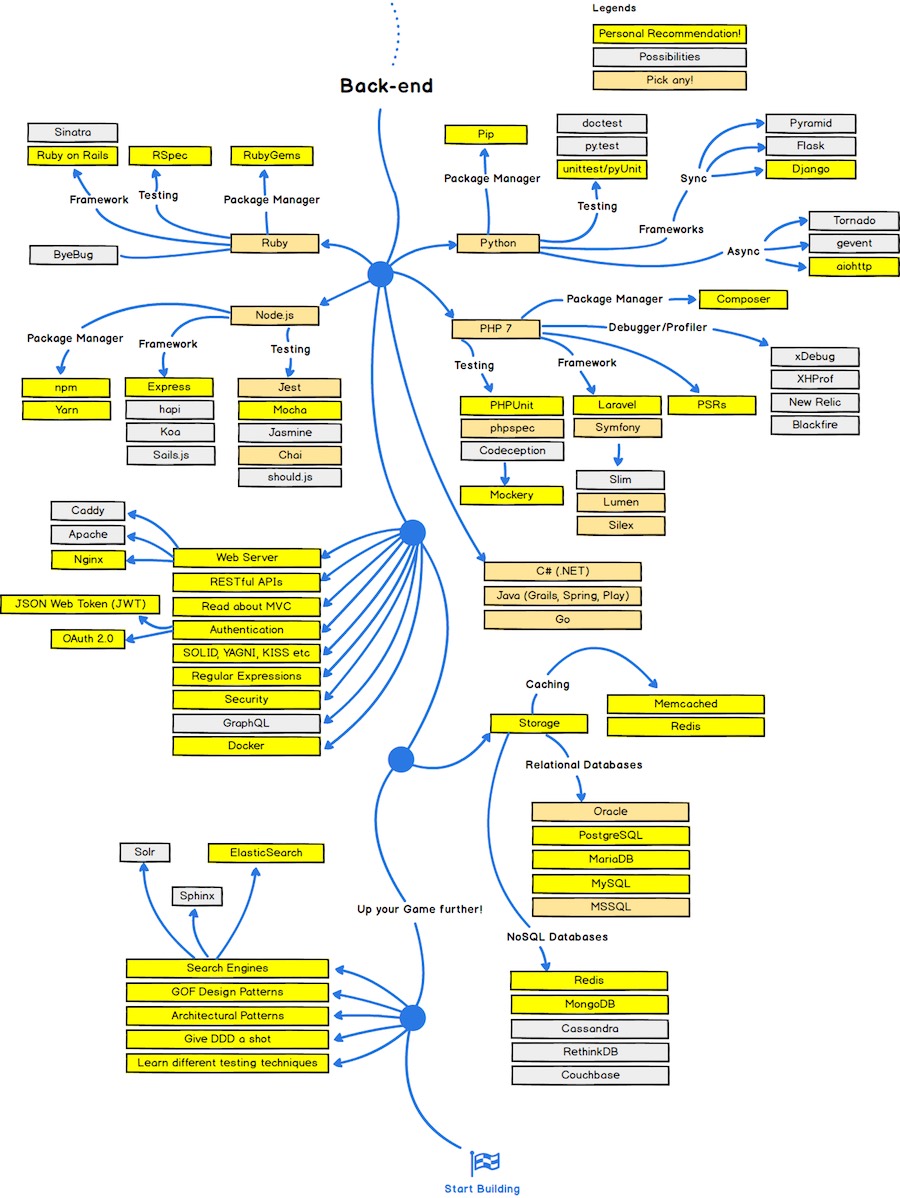
DevOps Roadmap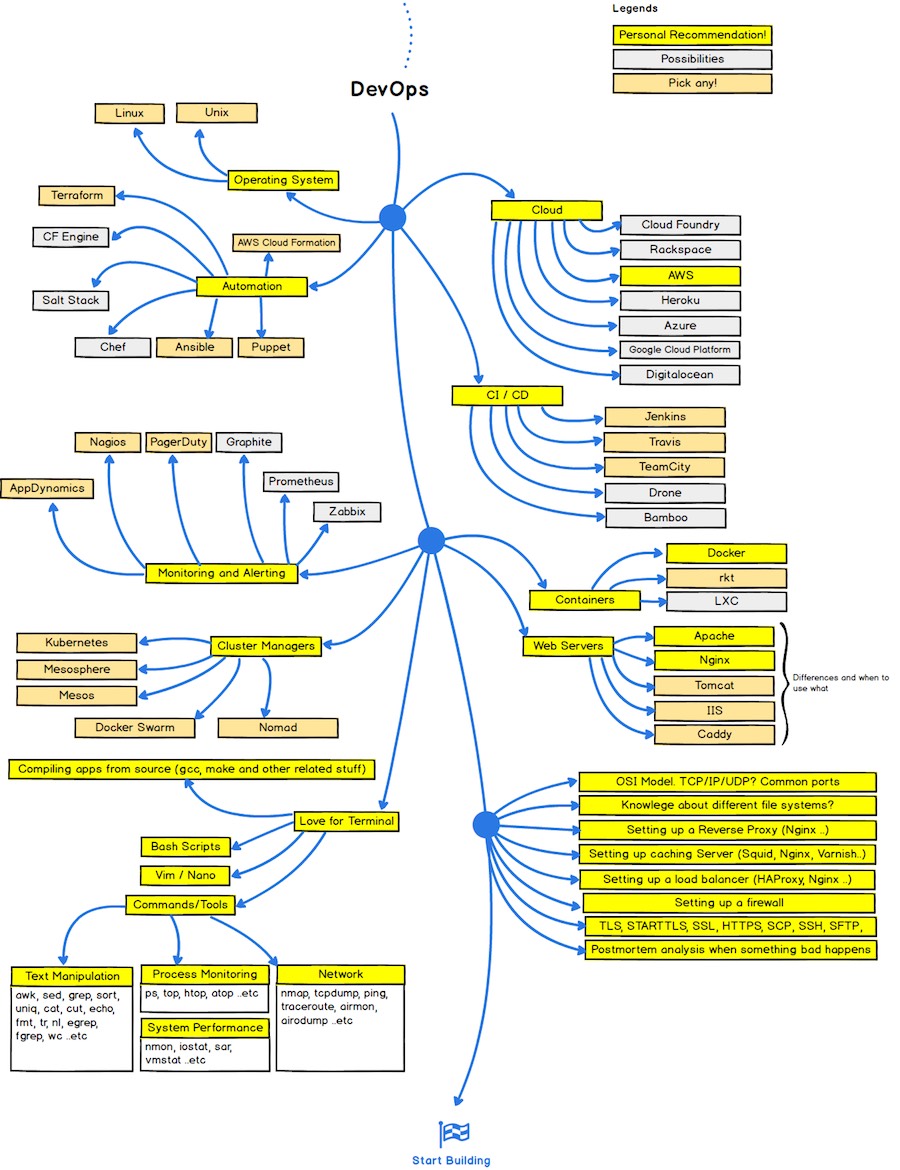
Built using Balsamiq, these charts are under Creative Commons license and you’re free to share them with others. Find the original copies here on GitHub.

0 comments:
Post a Comment